
Inflation, interest rates, house prices down, house prices up … the newspapers are full of column inches on Britains second favourite topic – the property market (the first being the weather obviously!).
Those of you that read my monthly market updates will know I like to look closely at what is happening in the Lancaster Housing Market.
Across the UK, house prices are up in one region, yet down in another. In Lancaster, they have remained relatively stable over the past 12 months. However, what is actually selling? Is there just one Lancaster property market or many?
I decided to look closer at the Lancaster housing market, to see how Lancaster house prices affect the saleability of a property.
This curiosity stems from the observation that properties, much like a spectrum, range from modestly priced to premium priced.
I decided the best way for this research was to split the Lancaster property market into four equal-sized distinct price ranges, each representing a unique slice of the market.
Imagine the entire range of house prices as a four-layer cake.
The lowest quartile forms the base layer, representing the most affordable 25% of homes – these are typically the most accessible for first-time buyers and buy-to-let landlords. Next up is the lower middle quartile, the second layer, encompassing properties priced between the 25th and 50th percentiles. These homes offer a step up in features, style or location while remaining within a moderate price range.
Ascending further, the middle upper quartile, the third layer, includes homes priced between the 50th and 75th percentiles, appealing to buyers looking for more amenities or premium locations. At the top sits the upper quartile, the cream of the crop, representing the most expensive 25% of properties in Lancaster. These homes are often luxurious, boasting high-end features and coveted locations, and are sought after by those who desire the best the market has to offer.
By segmenting properties into these quartiles, we gain insight into their saleability and can tailor strategies to target buyers effectively within each segment.
These are the quartile/house price bands for Lancaster:
- Lowest Quartile – (0 to 25% quartile in terms of house value) – Up to £150,000
- Lower Middle Quartile – (25% to 50% quartile in terms of value) – £150,000 to £190,000
- Middle Upper Quartile – (50% to 75% quartile in terms of value) – £190,000 to £270,000
- Upper Quartile – (highest 25% quartile in terms of value) – £270,000 upwards
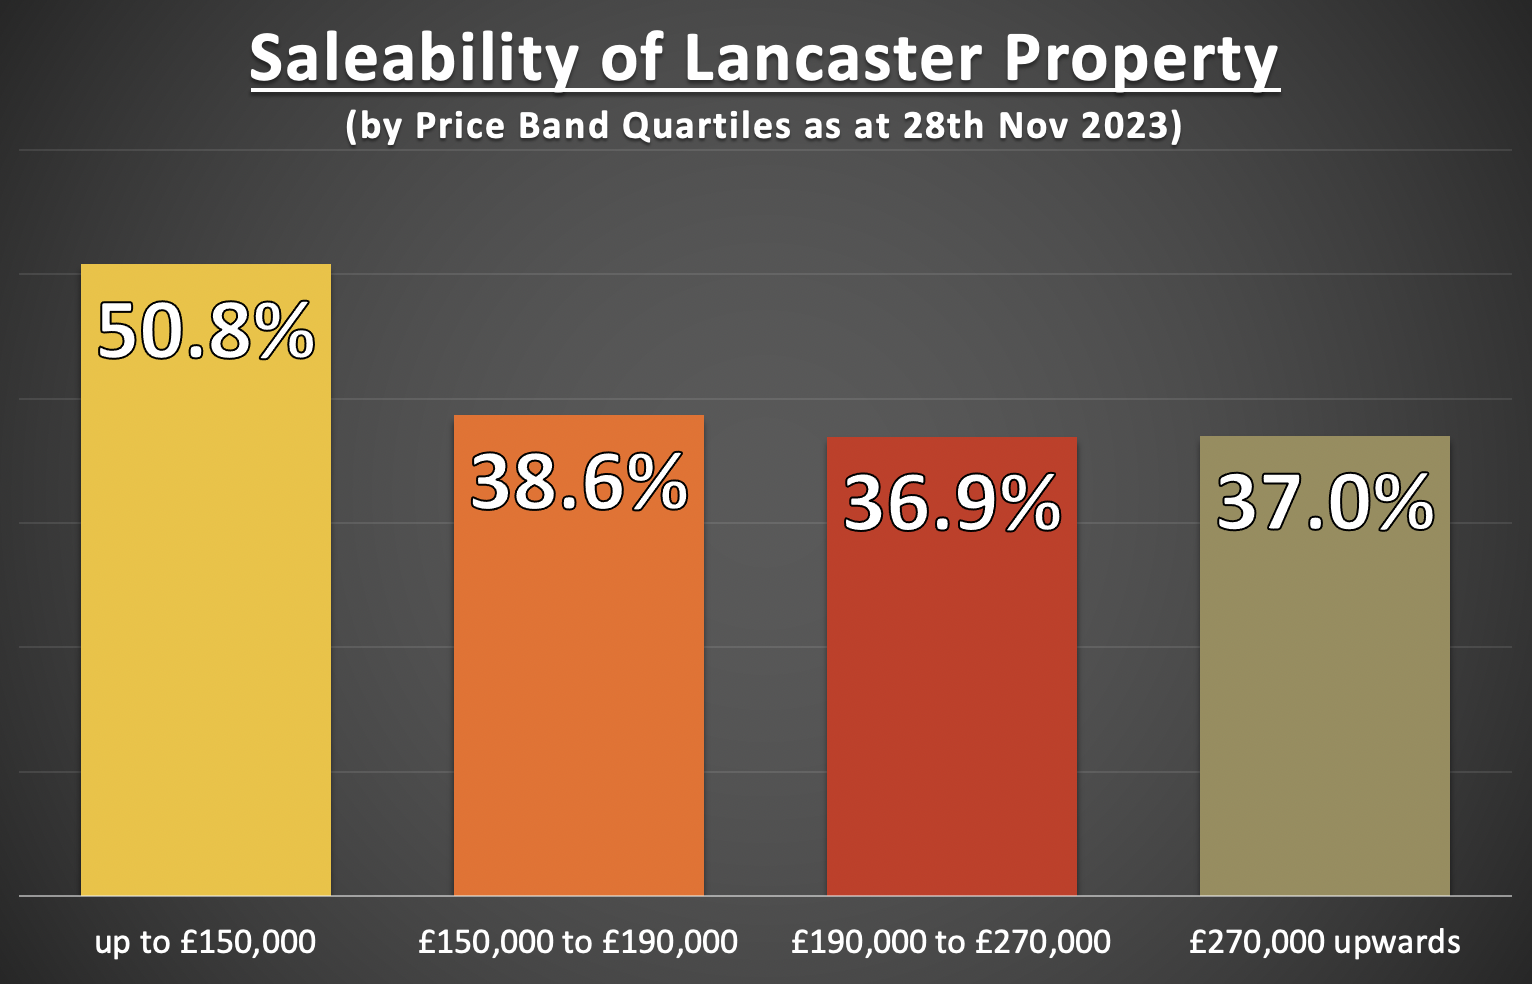
So, having split the Lancaster property market approximately into four equal sizes, the results in terms of what price band has sold (subject to contract or stc) the most is quite enlightening –
| Lancaster | Available | Sold STC | % Sold |
| up to £150,000 | 97 | 100 | 50.8% |
| £150,000 to £190,000 | 97 | 61 | 38.6% |
| £190,000 to £270,000 | 94 | 55 | 36.9% |
| £270,000 upwards | 104 | 61 | 37.0% |
The statistics across various price ranges present an interesting pattern. For properties priced up to £150,000, there are 97 available, with 100 already sold subject to contract (STC), representing a 50.8% sale rate.
In the next price band, £150,000 to £190,000, there are 97 properties available, with 61 sold STC, accounting for a 38.6% sale rate.
The £190,000 to £270,000 range shows 94 properties on the market, of which 55 have been sold STC, indicating a 36.9% sale rate.
Lastly, for properties priced at £270,000 and upwards, there are 104 available, with 61 sold STC, resulting in a sale rate of 37.0%.
The best-performing price range/quartile in the Lancaster area is the lower quartile market, with the middle quartiles and upper quartile ranges finding things a little tougher.
In analysing the Lancaster property market, it’s clear that the dynamics are multifaceted and cannot be neatly categorised under a single umbrella.
The market’s behaviour is akin to a kaleidoscope, with each turn revealing a different pattern based on the price segment. This diversity in performance across various price bands/quartiles is indicative of a market that caters to a wide spectrum of buyer preferences and financial capacities.
The most illuminating insight from this investigation is the relative success of different price quartiles.
The lower quartile, encompassing homes up to £150,000, has shown remarkable resilience, with a high percentage of properties going under contract.
This trend likely reflects a robust demand from first-time buyers and investors in moderately priced Lancaster properties.
In contrast, the other quartiles, representing the more expensive homes, face a slightly more challenging landscape. With a lower percentage of homes sold, these segments could be experiencing a slowdown, possibly due to its limited buyer pool or the broader economic factors affecting higher-end property investments and underlines the need for realistic pricing.
This disparity in market performance underscores the importance of understanding Lancaster’s property landscape through a segmented approach.
By recognising the unique characteristics and demand drivers within each quartile, estate agents, buyers, and sellers can make more informed decisions.
As a Lancaster estate agent, this insight into the local market’s not only enhances our ability to advise clients but also reinforces our commitment to providing tailored solutions that resonate with the diverse needs of the Lancaster community.
Do you have any questions? If so please ask away. I’m always here to help!
Thanks for reading
Michelle