41.16% of Lancaster households are 3–bedroom homes. Is that enough?
As a local estate and letting agent in Lancaster, it’s essential to analyse property trends, particularly focusing on bedroom distribution in different tenures. This detailed examination helps homeowners and landlords in making well-informed decisions, categorizing properties based on ownership and bedroom count.
Looking at different types of homes—like ones owned, ones owned with a mortgage, ones rented privately, and ones provided by social housing—helps us understand what people in Lancaster are looking for in housing. This is important for locals to know about because it gives us an idea of which types of homes are popular.
For example, if there are more smaller, one or two-bedroom homes being rented, it might mean more young professionals or small families are moving in. On the other hand, if there are a lot of bigger homes owned by families, it could mean that many families in the area value having more space and comfort.
This guidance is also helpful for Lancaster landlords looking for investment opportunities
Looking at the types of bedrooms in privately rented homes can help landlords decide where to invest. For example, if there aren’t enough three-bedroom rentals in Lancaster, a landlord might think about investing in properties to fill this need. This helps meet what people are looking for and makes renting more profitable.
Even our local government, Lancaster City Council, can use this info to see how their housing compares to private rentals!
Also, comparing what’s happening here in Lancaster with the whole country helps us see if Lancaster is following national trends. This could be important, especially if there are unique things people in Lancaster like in their homes that can be used for an advantage.
Let’s check out the types of homes in Lancaster and compare them to the rest of the country.
In the Lancaster area …
- 9.47% of Lancaster homes are 1 bed households, compared to 11.4% nationally.
- 29.17% of Lancaster homes are 2 bed households, compared to 27.1% nationally.
- 41.16% of Lancaster homes are 3 bed households, compared to 40.4% nationally.
- 20.20% of Lancaster homes are 4+ bed households, compared to 21.1% nationally.
Next, let me look at the distribution over the tenures in Lancaster …
- 38.60% of Lancaster homes are owned outright, compared to 32.8% nationally.
- 29.35% of Lancaster homes are owned with a mortgage, compared to 28.7% nationally.
- 10.26% of Lancaster homes are social rented (Council & Housing Association), compared to 17.1% nationally.
- 21.79% of Lancaster homes are privately rented, compared to 20.3% nationally.
And now let’s look at household tenure by bedrooms …
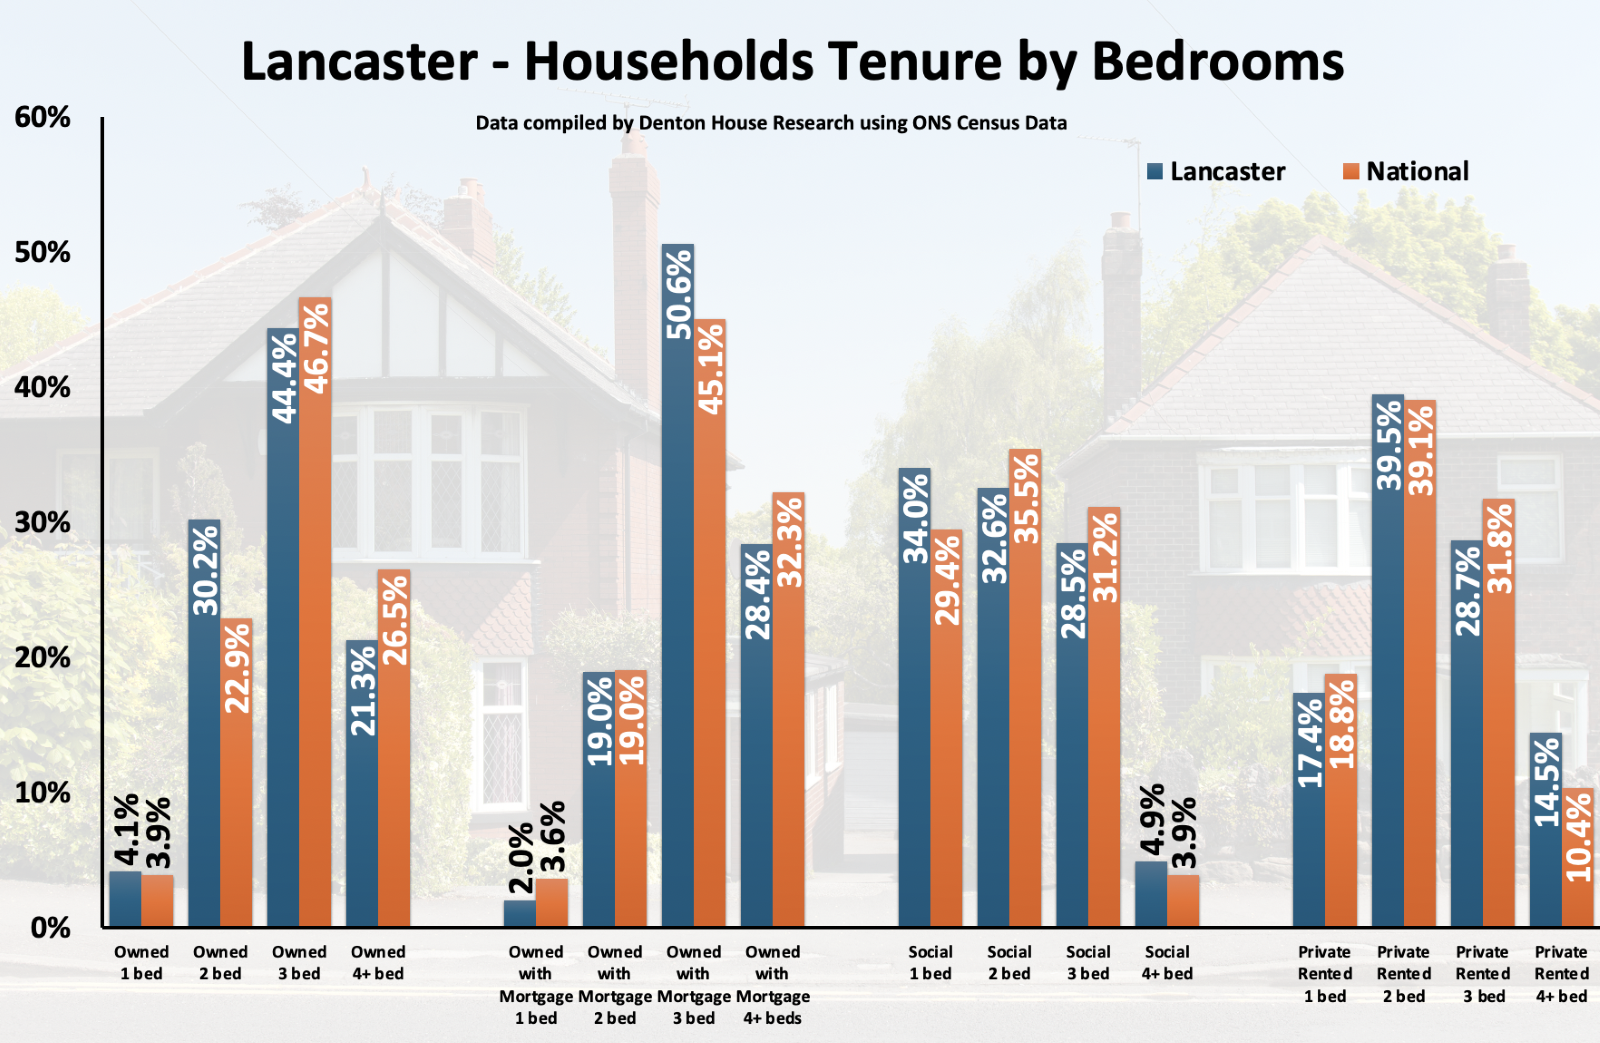
Owned Outright
- 4.14% of Owned households in Lancaster have 1 bedroom (compared to the national average of 3.9%).
- 30.22% of Owned households in Lancaster have 2 bedrooms (compared to the national average of 22.9%).
- 44.39% of Owned households in Lancaster have 3 bedrooms (compared to the national average of 46.7%)
- 21.26% of Owned households in Lancaster have 4 or more bedrooms (compared to the national average of 26.5%)
Owned with a Mortgage
- 2.02% of Owned (with a mortgage) households in Lancaster have 1 bedroom (compared to the national average of 3.6%)
- 18.95% of Owned (with a mortgage) households in Lancaster have 2 bedrooms (compared to the national average of 19.0%)
- 50.62% of Owned (with a mortgage) households in Lancaster have 3 bedrooms (compared to the national average of 45.1%)
- 28.41% of Owned (with a mortgage) households in Lancaster have 4 or more bedrooms (compared to the national average of 32.3%)
Social Renting
- 34.05% of Social Rented households in Lancaster have 1 bedroom (compared to the national average of 29.4%)
- 32.55% of Social Rented households in Lancaster have 2 bedrooms (compared to the national average of 35.5%)
- 28.46% of Social Rented households in Lancaster have 3 bedrooms (compared to the national average of 31.2%)
- 4.94% of Social Rented households in Lancaster have 4 or more bedrooms (compared to the national average of 3.9%)
Private Renting
- 17.39% of Private Rented households in Lancaster have 1 bedroom (compared to the national average of 18.8%)
- 39.48% of Private Rented households in Lancaster have 2 bedrooms (compared to the national average of 39.1%)
- 28.66% of Private Rented households in Lancaster have 3 bedrooms (compared to the national average of 31.8%)
- 14.47% of Private Rented households in Lancaster have 4 or more bedrooms (compared to the national average of 10.4%)
So, what does this all mean?
For people who own or rent homes in Lancaster, knowing how the number of bedrooms relates to different types of living situations helps them make smart choices about their property. It shows how important it is to understand the local property market when buying, selling, or renting.
As Lancaster changes, keeping up with these trends helps current property owners and attracts potential buyers and investors to the city.
To answer the initial question, 41.16% of homes in Lancaster have three bedrooms – is that good? Well, it’s hard to say in this short article because the types of homes vary. The goal here is to make you aware of the information and get you thinking.
Why? In the end, the most informed estate agents, homeowners, and landlords will see the value in detailed, local property insights. These insights help us all understand better what is really happening and needed in the local property market.
Thanks for reading
Michelle